PRTG and Custom Sensor Scripts
I wanted to get the result of a PowerShell (PS) script into PRTG to monitor the result of the script. This proved to be more challenging than I expected, mainly as there are some “gotchas” if you are running the script on a remote server/PC using the PRTG Remote Probe.
The key things which I learnt (aka tripped me up!) are:
- The PRTG Windows Remote Probe is still 32bit (x86), not 64bit (x64) so if you want to run a PS script, don’t forget to set the Execution Policy in 32bit PowerShell!
- By default, a script is executed under the account of the Remote Probe (Local System)
- The script runs non-interactively, so this might break a script which does something ‘special’
Things to Check
For either the Probe or Device, disable inheritance of Credentials for Windows System. In the screenshot below, Chorlton is the Probe.
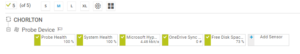
You can click either Chorlton or Probe Device (I’ve done this on the Probe Device item), then Settings and scroll down to find:
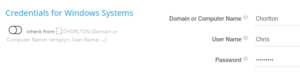
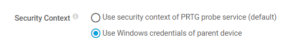
Once you’ve added your Advanced Custom Sensor, you need to tell PRTG to run the script under the credentials for the parent device. Click the sensor, then settings to find Security Context:
Your script needs to return either XML or JSON. The format for XML is:
<prtg>
	<result>
		<channel>First channel</channel>
		<value>10</value>
	</result>
	<result>
		<channel>Second channel</channel>
		<value>20</value>
	</result>
</prtg>
If you are debugging a script, turn on Store Results (under Settings for the Sensor):
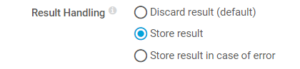
This will store the result on the probe in a text file so you can see your script is returning. For me, the path to that file was:
C:\ProgramData\Paessler\PRTG Network Monitor\Logs\sensors